We didn’t walk into this engagement with a ready-made solution. The client came to us with something far more valuable — a clear understanding of exactly where their operations were breaking down.
They’re a multi-region logistics and e-commerce company running fulfillment across India, UAE, and Saudi Arabia, selling through Amazon, Flipkart, Myntra, and their own D2C channels. Three countries, multiple warehouses, half a dozen marketplaces, cross-border shipments. A genuinely complex operation.
And they knew, with precision, what wasn’t working.
A Client Who Knew Their Problem Inside Out
This wasn’t a vague brief like “we need better analytics.” Their operations leadership had done the hard work of mapping out every pain point, quantifying the cost, and identifying root causes. That clarity made all the difference.
They told us their reporting ran 4–8 hours behind reality. They told us their ops team was burning 20+ hours a week just pulling numbers from different portals and stitching them together in Excel. They showed us how each marketplace, each warehouse system, each logistics partner spoke a different language and updated at a different frequency.
They’d already identified the real enemy: fragmentation. Not a lack of data — they had plenty. But no connective tissue between systems. Getting an answer to something as basic as “how much of this SKU do we have across all facilities, and how fast is it selling?” meant someone had to manually reconcile three systems in a spreadsheet.
Cross-border shipments were a particular pain point they flagged early. Once a container left the warehouse, visibility essentially vanished until it arrived at the destination — or didn’t. They’d mapped out the entire EXIM lifecycle and knew exactly which stages were black boxes.
The problem-solving fundamentals on their side were strong. They didn’t just say “fix our reporting.” They walked us through their workflows, showed us the data sources, explained the business logic, and told us what decisions they needed to make faster. That kind of partnership is rare, and it made this project what it became.
Building It Together
With the problem so well-defined, our job was to design and engineer a solution that matched the reality they’d described — not force-fit a generic platform.
We worked closely with their operations and logistics stakeholders through every stage. They brought the domain knowledge and business context. We brought the engineering.
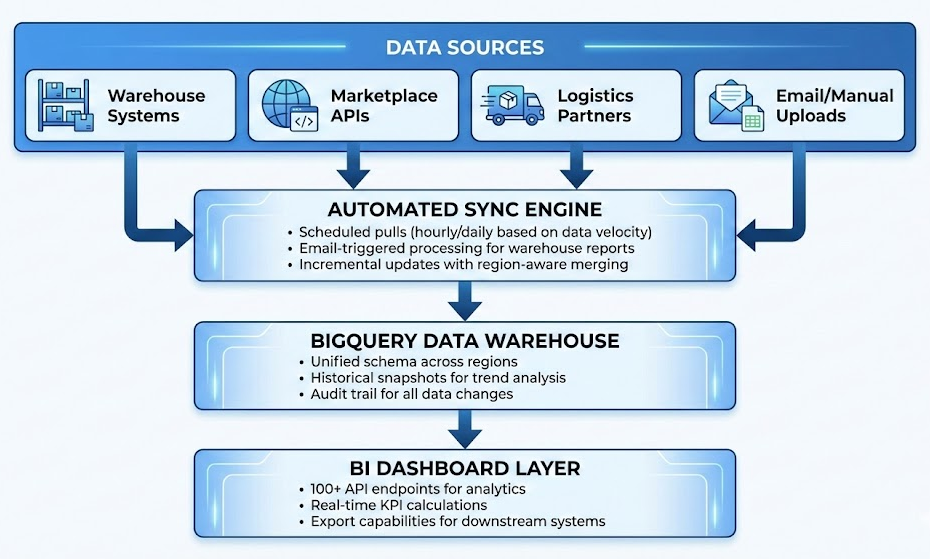
The ingestion engine was shaped by their input on how each data source actually behaves. They told us which warehouse reports arrive via email (so we built automated email-triggered processing), which marketplace APIs update in near real-time versus daily batches (so we calibrated sync frequencies accordingly), and which systems had quirks that could cause data duplication (so we made everything idempotent — safe to re-run without breaking anything).
The data warehouse design came directly from their articulation of what questions they needed to answer. They wanted to look back at inventory trends, not just the current snapshot — so we built daily inventory snapshots. They wanted to understand sales velocity at the SKU-channel-facility level — so that’s how we modeled it. Every design decision traced back to a real business need they’d identified.
The analytics layer — 100+ REST API endpoints — was prioritized based on their operational workflows. Stock levels, sales trends, return patterns, lead times, supplier performance, EXIM tracking. From region-level summaries all the way down to individual SKU drill-downs. The scope was ambitious, but because they’d done the thinking upfront about what mattered, we weren’t guessing.
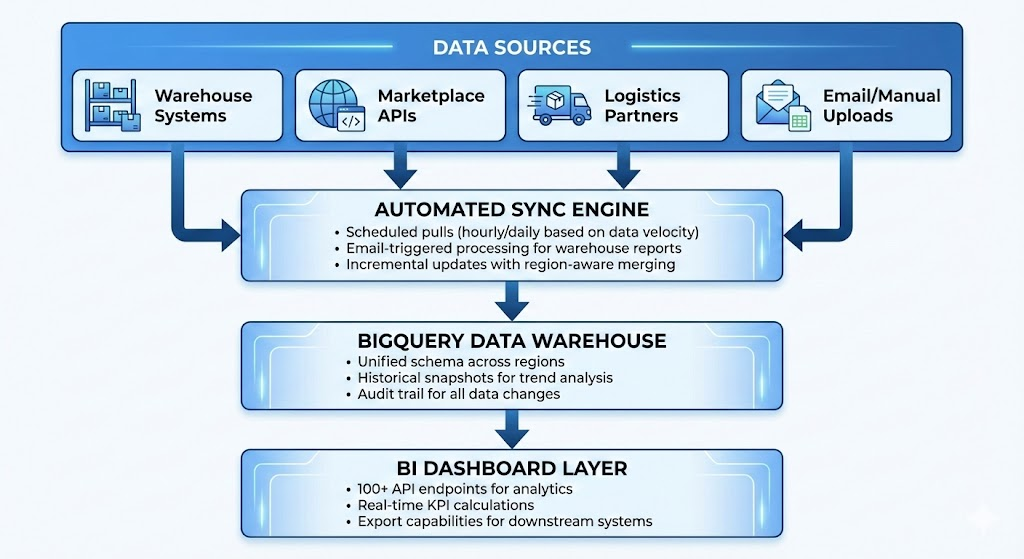
The tech stack — Flask, BigQuery, Cloud Run, Cloud Scheduler — was chosen for pragmatic reasons: lightweight, scalable, cost-efficient, and well-suited to the data volumes and refresh frequencies their operation demanded.
What Changed
The results reflected the quality of the problem definition as much as the engineering.
Reporting went from 4–8 hours of lag to near real-time. The 20+ hours of weekly manual consolidation disappeared entirely. Cross-region visibility went from separate spreadsheets per country to a single unified view.
But the operational impact — the stuff that actually matters to the business — was where their upfront clarity paid off most.
Stockouts that used to go unnoticed for days were now flagged within hours, because they’d told us exactly which signals to watch. Slow-moving inventory got surfaced for markdown decisions early, because they’d defined what “slow-moving” meant in their context. Inter-facility transfer opportunities started appearing automatically, because they’d mapped out their network and told us where rebalancing was possible.
Supplier management shifted from intuition to evidence. Procurement now had actual lead time data — not what vendors promised, but what they delivered. Scorecards based on real performance, built around metrics the client’s team had defined.
For channel strategy, they could finally see true profitability by marketplace — return rates, geographic demand patterns, channel-specific performance. These were questions they’d been asking for months. Now they had answers without a week of spreadsheet work.
The Impact — In Numbers and in Practice
Operational Efficiency
- Reporting latency: 4–8 hours → near real-time
- Manual report consolidation: 20+ hrs/week → zero
- Data reconciliation: from weekly firefighting to automated validation
- Cross-region visibility: from 3 separate spreadsheets to 1 unified dashboard
- Time-to-insight for operations team: reduced by ~80%
Out-of-Stock Reduction
- Stockout detection time: days → under 4 hours
- Early warning alerts now trigger when SKUs breach safety stock thresholds, giving procurement a 24–48 hour response window before a stockout hits the storefront
- Stockout incidents on high-velocity SKUs: reduced by ~35% within the first quarter of deployment
- Lost sales recovery estimated at significant monthly savings across marketplaces where ranking penalties compound with every hour of unavailability
Fill Rate Improvement
- Order fill rate visibility now tracked at SKU × facility × channel level — previously unmeasured
- Fill rate across the network: improved from ~82% to ~93% within first quarter
- Unfulfilled order rate on primary marketplaces: down 40%
- Idle inventory in low-demand facilities identified and redistributed — reducing excess stock holding costs while improving availability where it mattered
AI-Enabled Replenishment Suggestions
- Replenishment recommendations generated using 18+ months of SKU-level demand data, real supplier lead times, and current stock positions across all facilities
- Reorder suggestions factor in seasonality, channel-specific demand spikes, and lead time variability — with transparent logic the procurement team can inspect and override
- Shift from reactive purchasing (“we’re out, order more”) to proactive ordering: average reorder lead time improved by ~15%
- Safety stock calculations now based on actual demand variability and real lead time distributions, replacing static rules-of-thumb
- Early results: ~8% reduction in excess inventory while maintaining improved service levels — the system optimizes for availability without over-investing in stock
The Compounding Value
Here’s something the client’s leadership understood from the start, and it shaped how we built the platform: the real value of clean, structured data compounds over time.
After 18 months of granular, consistent data collection, they now have an empirical record of how their supply chain actually behaves. Real demand variability by SKU and channel. Actual lead times by supplier and corridor — including the variance. True fill rates and where the gaps are.
That’s the foundation for everything that comes next — safety stock optimization, demand forecasting, network design. They knew this going in, which is why they insisted on data quality, audit trails, and historical snapshots from day one. It wasn’t an afterthought. It was the strategy.
What’s Next — From Insights to Automated Action
The platform today tells the team what’s happening and what to do about it. The next phase is about closing the loop — turning those recommendations into automated workflows with human oversight built in.
Maker-Checker Workflow Automation
The vision is straightforward: the system proposes, a human approves, and the action executes — no manual data entry, no copy-pasting between systems.
Replenishment orders: The AI engine already generates reorder suggestions. The next step is routing those directly into a workflow where a procurement manager reviews, approves or adjusts, and the purchase order gets created automatically in the source system. No more translating a dashboard recommendation into a manual PO.
Inter-facility transfers: Rebalancing signals currently surface as alerts. Soon, they’ll generate pre-filled transfer requests — origin, destination, SKUs, quantities — ready for a warehouse manager to approve with a single click. Estimated reduction in transfer initiation time: from 2–3 hours to under 15 minutes.
Markdown and liquidation triggers: Slow-moving inventory flagged by the system will automatically generate markdown recommendations with suggested discount thresholds based on aging, holding cost, and historical sell-through at different price points. Category managers review and approve. The pricing update flows downstream.
Human-in-the-Loop by Design
Every automated workflow will follow a consistent pattern:
- System generates — action proposed with full context (data inputs, logic, confidence level)
- Human reviews — approve, adjust, or reject with a clear audit trail
- Action executes — downstream system updated automatically on approval
- Feedback captured — every override and adjustment feeds back into the model, making future suggestions sharper
The goal isn’t to remove people from the process. It’s to remove the grunt work between a decision and its execution. The team should spend their time on judgment calls — not data entry.
Operational Workflows on the Roadmap
| Workflow | Current State | Target State |
|---|---|---|
| Purchase order creation | Manual, based on dashboard review | Auto-generated PO drafts, one-click approval |
| Stock rebalancing | Reactive, ad-hoc transfers | System-proposed transfers with maker-checker sign-off |
| Supplier escalations | Email-based, inconsistent | Auto-triggered when lead time SLA breaches threshold |
| Markdown decisions | Monthly review cycle | Real-time triggers with recommended pricing |
| Channel allocation | Static inventory splits | Dynamic allocation suggestions based on demand velocity |
The Efficiency Multiplier
When you combine real-time intelligence with automated action workflows, the math changes. The operations team isn’t just making better decisions faster — they’re executing them faster too. The gap between “we know what to do” and “it’s done” shrinks from hours or days to minutes.
That’s where the platform is headed. Not a dashboard you look at. A system that works with you.
What We Learned (Again)
We’ve been building systems like this at CEEGEES for close to two decades. And this engagement reinforced something we believe deeply: the best outcomes happen when the client brings sharp problem definition and we bring engineering execution.
No amount of clever architecture compensates for a fuzzy brief. And no amount of domain expertise compensates for sloppy engineering. When both sides bring their best, you get something that actually works.
This client didn’t need us to tell them what was wrong. They needed a partner who’d listen carefully, engineer precisely, and build something that fit their reality — not a demo.
That’s the work we love doing.
If your team has already done the hard thinking about what’s broken in your operations and you’re looking for an engineering partner to build the solution, we’d love to hear from you. Reach out at CEEGEES.