
Investing in the stock market provides a range of benefits, making it a compelling choice for wealth building and achieving financial objectives. This guide will walk you through the process of creating a Demat account and highlight the many advantages of investing in stocks.

Steps to Create a Demat Account
To start trading, you’ll need a Demat (dematerialized) account to hold your shares in electronic form. Here’s how to get started:
Choose a Depository Participant (DP): A DP is an agent of the depository (NSDL or CDSL in India) that offers Demat services. Popular choices include:
- Zerodha: Known for its low brokerage fees and user-friendly interface.
- Upstox: Offers a seamless experience with advanced charting tools.
- ICICI Direct: Provides comprehensive services with integrated banking.
Submit Your Documents: You’ll need to provide:
- Proof of identity (Aadhaar card, PAN card)
- Proof of address (Utility bills, passport)
- A recent passport-sized photograph
- A canceled cheque for linking your bank account
Complete the KYC Process: This can be done online through e-KYC. You’ll need your Aadhaar number and PAN card. Some platforms also offer video KYC for added convenience.
Sign the Agreement: Read and sign the terms and conditions provided by the DP.
Get Your Account Details: Once your application is processed, you’ll receive your Demat account number and login credentials.
Intraday Trading vs. Delivery

Intraday Trading
This trading involves buying and selling shares within the same trading day, aiming to profit from short-term price movements.
Advantages
- Potentially High Profits: Skilled traders can capitalize on short-term price movements.
- Flexibility: Quick entries and exits allow adaptation to market fluctuations.
- No Overnight Risk: Avoid exposure to events impacting prices after market close.
- Leverage: Use borrowed funds to control larger positions with less capital.
Risks
- High Volatility: Prices can change rapidly.
- Psychological Demands: Requires constant attention and quick decision-making.
- High Transaction Costs: Frequent trading leads to higher fees.
- Skill and Experience: Success requires a high level of expertise.

Delivery Trading
Delivery trading involves buying shares to hold for a longer period, with the intention of benefiting from long-term gains.
Advantages
- Lower Volatility: Less exposure to short-term price swings.
- Less Time Commitment: Requires less active monitoring.
- Deeper Analysis: Allows for thorough research and fundamental analysis.
- Lower Transaction Costs: Fewer trades mean reduced fees.
- Beginner-Friendly: Easier learning curve compared to intraday trading.
Risks
- Lower Profits: Gains are generally smaller compared to intraday trading.
- Overnight Risk: Exposure to news events impacting prices before the next trading day.
- Patience and Discipline: Requires waiting for opportune entry and exit points.
How to Select a Company for Investing
- Fundamental Analysis: Evaluate a company’s financial health, competitive advantages, management team, and future prospects. Resources include financial statements, annual reports, and industry reports.
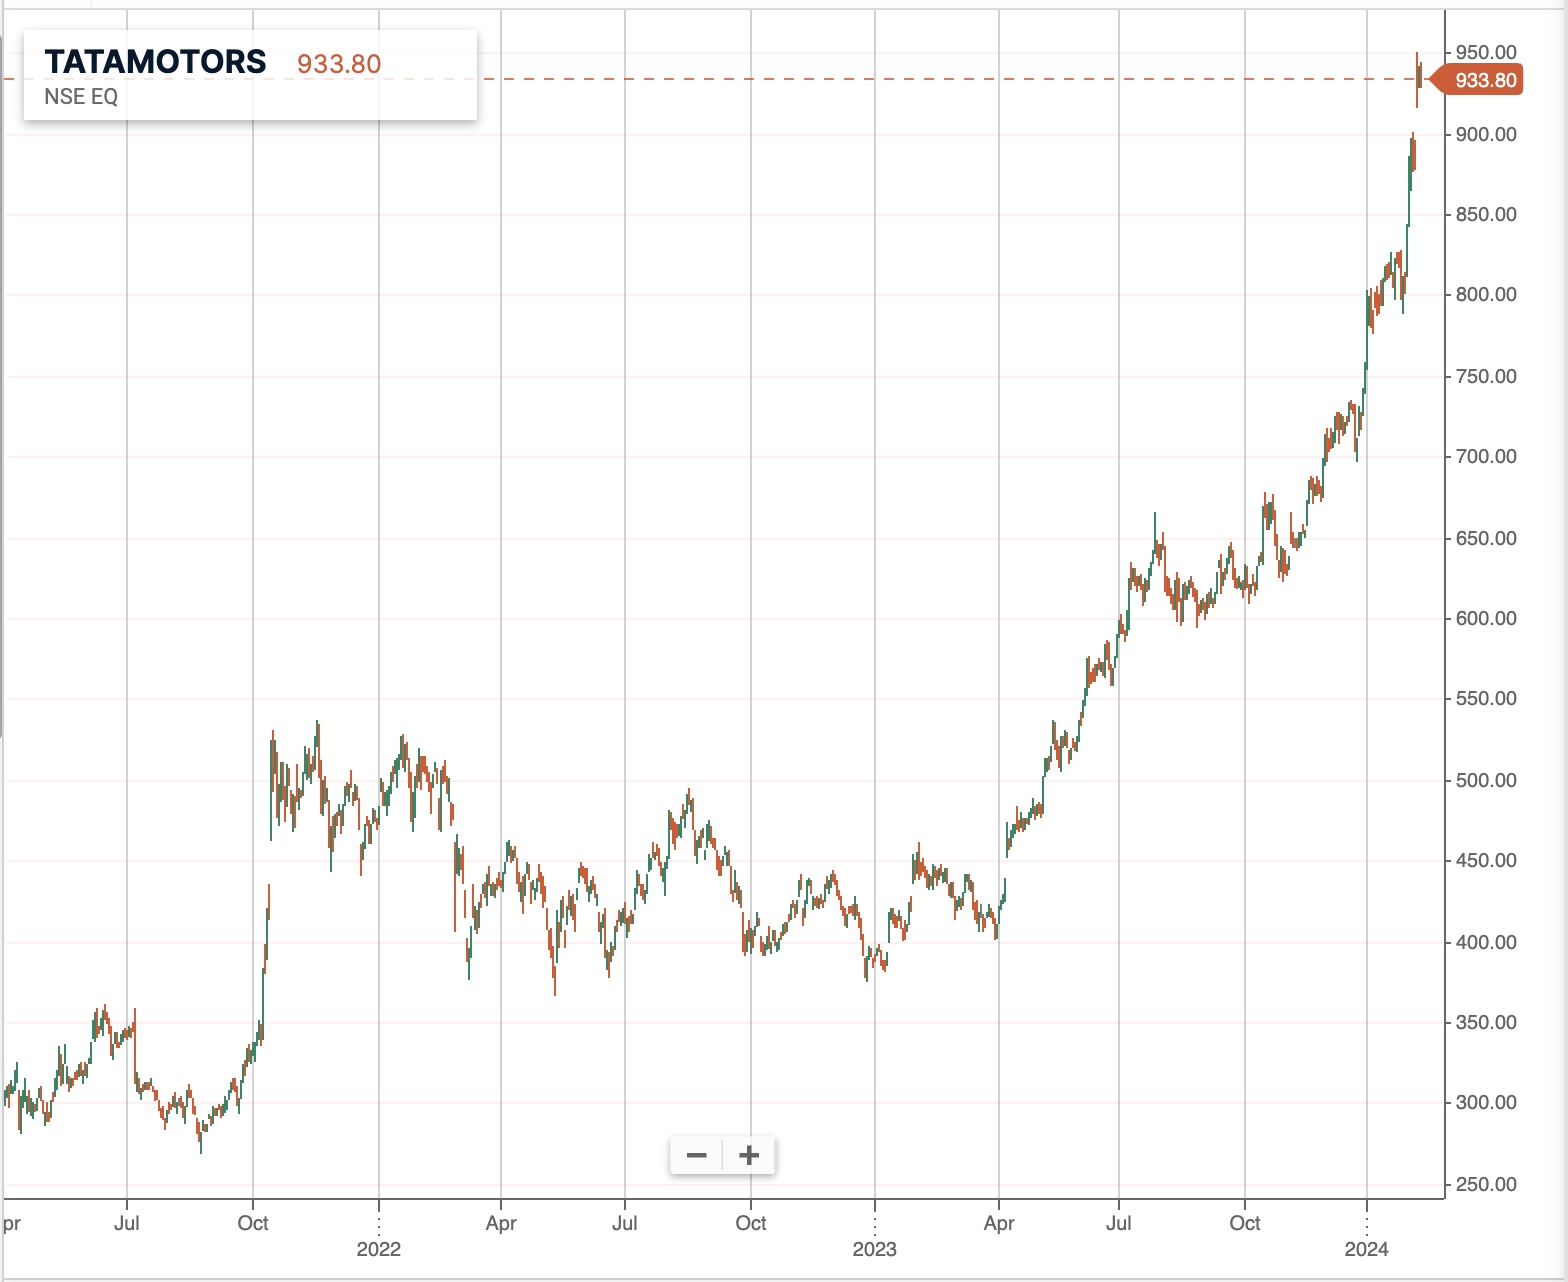
- Technical Analysis: Study historical price charts and indicators to identify potential trading opportunities. Resources include charting software and technical analysis books or courses.
Resistance & Support
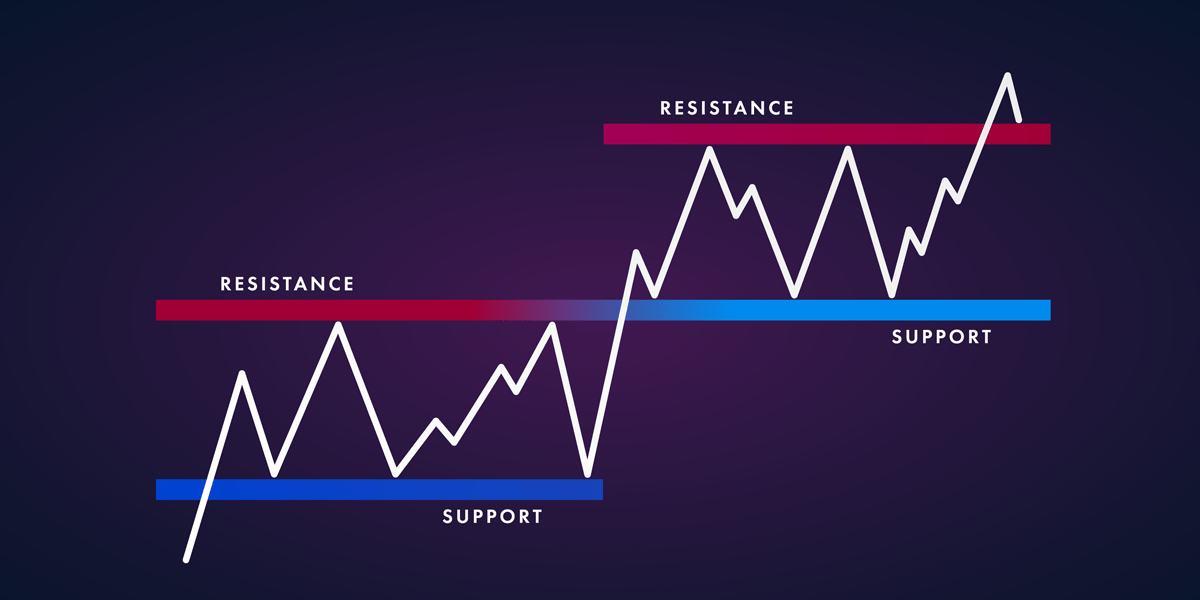
Resistance: A price level where selling pressure prevents further price rise, acting as a ceiling.
Support: A price level where buying pressure prevents further price decline, acting as a floor.
What is a Candle?
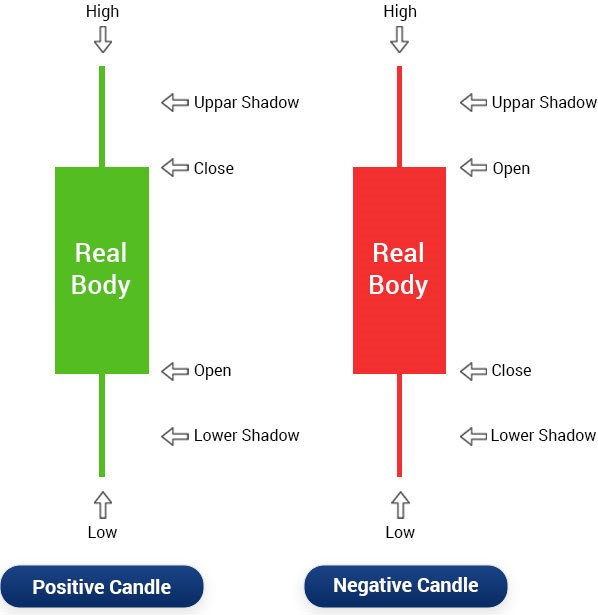
Candlesticks are visual representations of price activity in a stock over a specific time frame. Each candlestick shows the opening, closing, high, and low prices.
- Bullish Candle: Indicates a price increase. In the picture above, the green figure depicting positive candle is bullish.
- Bearish Candle: Indicates a price decrease. In the picture above, the red figure depicting negative candle is bearish.
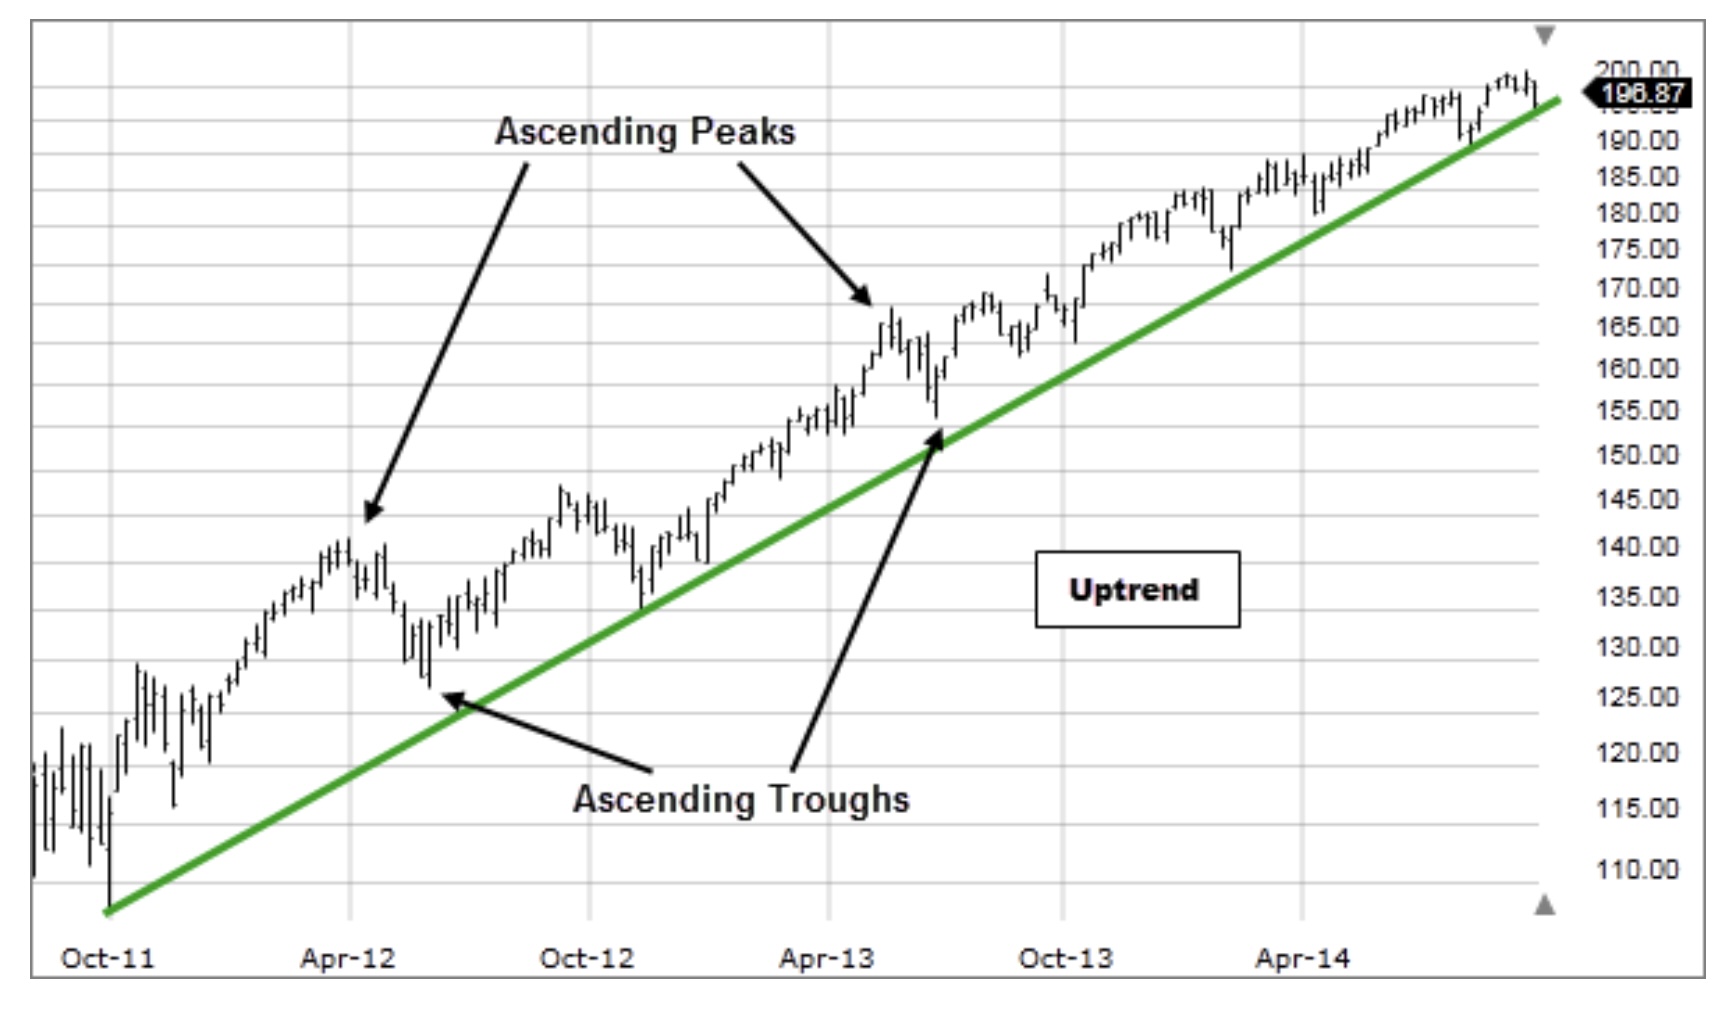
Trends in Graphs
- Uptrend: An uptrend is a sustained increase in prices, marked by higher highs (HH) and higher lows (HL).
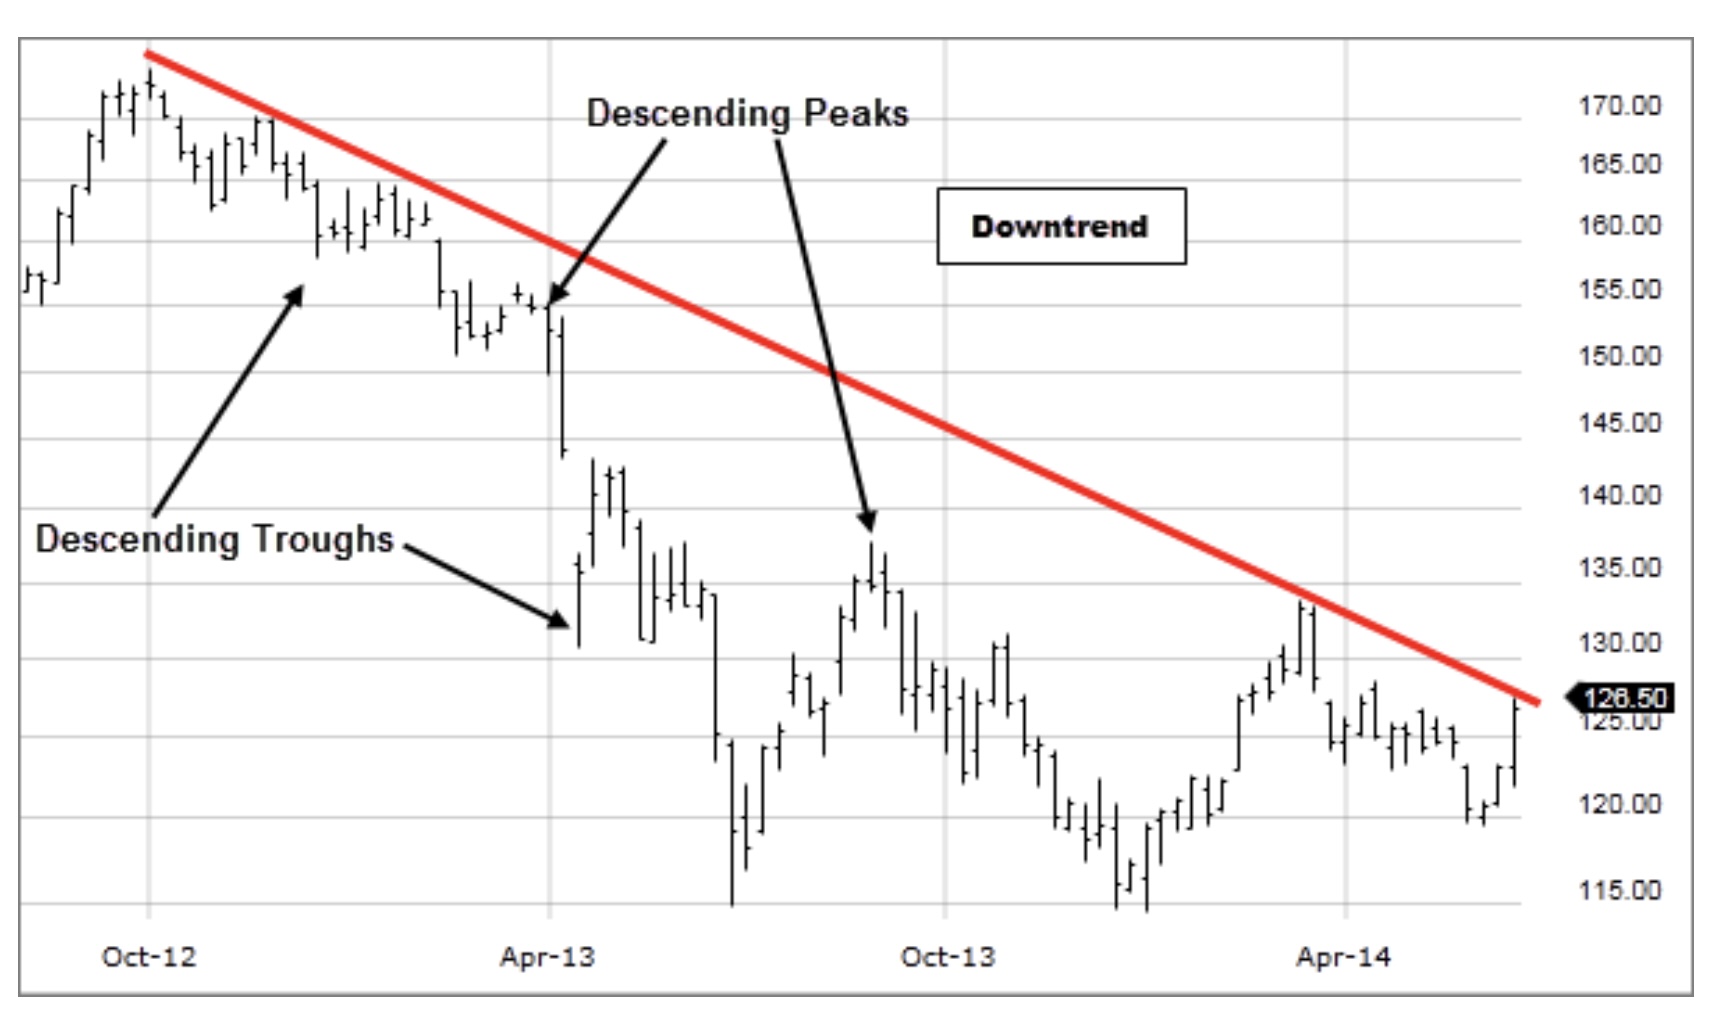
- Downtrend: A downtrend is a sustained decrease in prices, marked by lower highs (LH) and lower lows (LL).
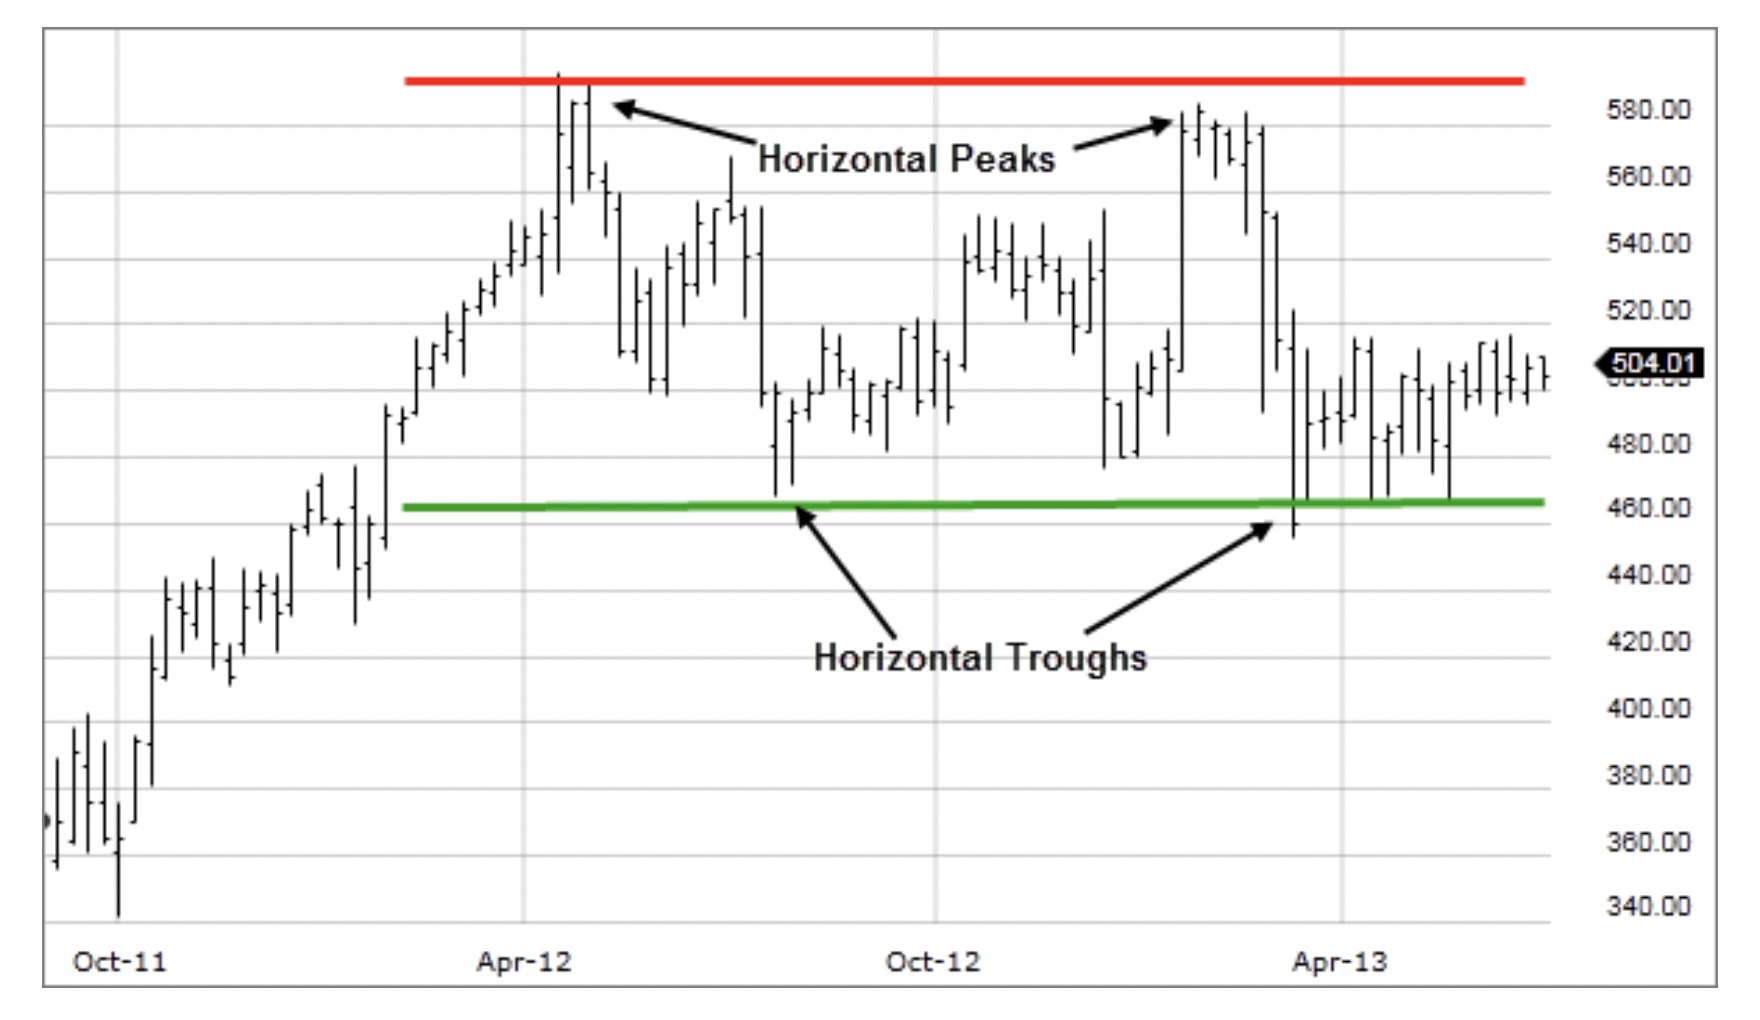
- Sideways Trend: A sideways trend (consolidation) occurs when prices move horizontally within a range, showing either upward or downward momentum.
Conclusion
The stock market offers both opportunities and challenges. By conducting thorough research and staying informed, you can make well-informed investment decisions.
Also, a few professional videos that we believe you could watch before making stock market investments include youtube videos from Pranjal Kamra, Rachana Ranade, Nitin Bhatia, Gaurav Jain, Akash Goyal, Sunil Minglani, and Varun Malhotra.
In case, you want to refresh the basics of stock market, then please refer to the blog Introduction to Stock Market: Beginner’s Guide.
For further information and understanding of the topic you can refer to the youtube link attached below:
Disclaimer: The information, data, and/or material available on this website may not be accurate, adequate, reliable, current, functional, timely, continuous, performative, or complete. CeeGees expressly disclaims liability for any errors or omissions in this information, data, and/or material. Neither explicitly nor implicitly does CeeGees warrant, guarantee, or make any representations regarding the use, results of use, or inability to use or access the information or contents of this website.